Updated 2026-04-29: I've added the Aerolamp DevKit, which is considerably cheaper than the Krypton-11 consumer UVC lamp, to the cost table and made related changes to the post to reflect it. Thank you Jeff Kaufman for bringing this to my attention.
Discussions of built-environment pandemic defense tend to treat far-UVC as the standout technology and air filtration as an afterthought. I think this overemphasizes far-UVC. The technologies are close substitutes—both deliver effective air changes per hour, both reduce airborne pathogen concentrations by the same amount per eACH—and on current pricing, filtration is cheaper. Far-UVC will get cheaper as KrCl emitters scale but is unlikely to ever become substantially cheaper than air filtration.
Part 1 works through the per-unit comparison between far-UVC and air filtration. Part 2 argues that neither technology will be deployed widely enough to matter during a catastrophe without a deliberate push.
Note that I use "UVC" throughout to mean far-UVC (mostly 222 nm, but the class extends to the ~200–230 nm band) unless otherwise specified. This isn't a general overview of far-UVC—if you want one, Blueprint Biosecurity's Blueprint for Far-UVC is the best place to start.
1. UVC and other air cleaning technology
UVC, air filtration, and ventilation are substitutes
A typical room in a house has some natural ventilation: air leaks in and out through gaps, and through open doors and windows. This air exchange happens slowly, with the entire volume of air in the room replaced, on average, about once every hour. In other words, the room has about 1 air change per hour (ACH). Opening a window raises this; running an HVAC system raises it further.
Air changes matter for disease because they remove airborne pathogens. If someone exhales an infectious aerosol, it will linger in a 1 ACH room for about an hour before the air carrying it gets replaced. Anyone in the room during that time has a chance of breathing it in. Doubling the rate at which the air is replaced to 2 ACH halves how long the aerosol lingers, and roughly halves the risk of infection.
Air filters and UVC work through the same channel, but in different ways:[1]
- Air filtration pulls room air through a filter, which captures aerosols and returns clean air to the room. An air filter that processes the full volume of the room once per hour is equivalent to 1 ACH of additional ventilation.
- UVC shines ultraviolet light through the air, inactivating pathogens within aerosols. The aerosols stay in the room, but the pathogens inside them are dead. A UVC system that inactivates pathogens across the full volume of the room once per hour is also equivalent to 1 ACH of additional ventilation, though the effective rate depends on the pathogen and on aerosol size—UVC is more effective against some pathogens than others, and less effective against larger droplets (see Appendix 1).
When ACH from ventilation, filtration, and UVC are added together, the combined quantity is called effective ACH (eACH). A room with 1 ACH of background ventilation, a filter delivering 2 ACH, and UVC delivering 2 ACH has 5 eACH. Each filter or UVC lamp you install adds a fixed amount to the room's eACH; having two filters or two UVC lamps will deliver twice the eACH of one filter or one lamp.
UVC is currently more expensive than air filtration
Cost per eACH depends on room size: a bigger room needs more equipment for the same clearance rate. We can get a defensible comparison by working through a specific case. Take a moderate room, 30 m² floor, 2.5 m ceiling, 75 m³, similar in size to a bedroom or small office:
| Technology | eACH | Upfront $/eACH | 5-year $/eACH |
| HEPA filtration | |||
| AirFanta 3Pro[2] | 8 | $20 | $53 |
| Corsi-Rosenthal box | 5 | $20 | $63 |
| Box fan + MERV-13 | 2.5 | $16 | $79 |
| Philips 4000i (commercial) | 8 | $67 | $99 |
| Germicidal UV (254 nm) | |||
| Upper-room GUV[3] | 12 | $208 | $261 |
| Far-UVC (222 nm) | |||
| Aerolamp DevKit[5] | 7 | $71 | $74 |
| UV Medico (commercial) | 7 | $286 | $295 |
| Krypton-11 (consumer) | 4 | $625 | $729 |
| Future projection (Blueprint) | 7 | $16 | $18 |
The underlying numbers and sources are in Appendix 1. For the UVC rows, we're assuming typical respiratory viruses; performance would be worse against more UV-resistant pathogens like adenovirus and bacterial spores. The table omits ventilation: in practice it's essentially free eACH where the building supports it, but availability is heavily constrained by HVAC capacity, climate, and heating and cooling costs that scale with outdoor airflow. Installation cost is excluded across the table except for the upper-room 254 nm GUV row, which is the only fixture that requires professional installation. Comparison also depends on room size: UVC's per-eACH cost falls relative to filtration in larger or taller spaces, where filters multiply with volume but a single UVC fixture can illuminate a bigger air column.
Blueprint projects a future KrCl fixture at $110, 30,000 hours, and $0.19 per mW per year—an order of magnitude below today's commercial pricing (Blueprint for Far-UVC (2025) Table 8.2). At those numbers far-UVC lands well below commodity HEPA on $/eACH, conditional on dichroic-filter costs falling to about $50 per unit, emitter lifetimes hitting 30,000 hours in practice, and the KrCl market scaling to match Blueprint's model.
Filter media and box fans are mature commodity products, so filtration sits near a cost floor.[4] Excimer emitters are still pre-scale and have meaningful headroom to fall. Reaching rough parity with filtration seems plausible, but I'd be surprised to see far-UVC substantially beat it.
If safety allows, far-UVC scales more easily to high eACH than air filtration
With both UVC and filtration, you can increase eACH by adding more units. But neither scales indefinitely.
Air filters can become noisy and generate uncomfortable amounts of airflow. Worse, because they physically move air around, you can run into dead spots or short-circuiting—one filter's output getting sucked into another's input without actually mixing through the room. Achieving 25 eACH isn't that hard—aircraft cabins run at roughly 20 ACH at cruise (WHO (2008)) and operating rooms are mandated at 20+ ACH by ASHRAE Standard 170—but beyond this things get progressively more challenging. Specialized facilities like semiconductor fabs hit hundreds of eACH, but require purpose-built spaces with laminar flow.
UVC, by contrast, scales mostly by adding more fixtures until you run out of space. The main issue becomes safety. Although 222 nm light doesn't penetrate far into either skin or the eye, long-term human exposure data is limited for both, and there are open questions about secondary chemistry in indoor air—see the Blueprint for Far-UVC for details. At current ACGIH TLVs, the safety-limited eACH ceiling probably sits somewhere in the tens to low hundreds for most respiratory viruses, though where exactly depends on pathogen \(k\), room geometry, and how conservatively you apply the limit. In addition to potential harm to human health, UVC also degrades plastics and other surfaces over time, although this isn't very well characterized.
Other differences between UVC and filtration are minor for normal use
Setting cost aside, the other differences between UVC and filtration at normal eACH levels are small and don't clearly net out.
UVC's advantages are form-factor and noise: ceiling-mounted fixtures are silent and out of the way, where filters are floor-standing units with audible fans. UVC also disinfects illuminated surfaces, which cuts into fomite and short-range transmission that filtration can't touch, though I expect both effects to be minor for most respiratory viruses. Blueprint projects that at scale UVC could become several times more energy-efficient than filtration (Blueprint for Far-UVC (2025) Table 8.2), though the two are comparable today.
Filtration's advantages run the other way. Filter media captures PM, pollen, and some VOCs as a side effect of pulling aerosols out of the air—an independent reason to run a filter in a home or office, and a meaningful benefit in cities or during wildfire season. Filters also don't have the open human-exposure nor material degradation issues that we noted for UVC in the previous section. At moderate eACH I don't think these should be major blockers to adoption, but I'm not certain.
2. Deploying UVC
UVC in workplaces and schools provides modest protection against seasonal respiratory disease
How much would installing UVC in a workplace reduce the time workers spend sick? Two factors limit the effect.
The first is that workplaces are a modest source of infection for adults. Most respiratory viruses come from family members, public transit, and social contacts; the office is one setting among many. Eliminating workplace transmission entirely would avert only a fraction of an adult's annual infections.
The second is that UVC acts primarily on long-range aerosol transmission. This carries perhaps half of total respiratory transmission (Wang et al. (2021); Leung (2021)), with the rest going through short-range droplets, direct contact, and fomites. Even a perfect UVC installation in every room of a workplace would block at most half of within-workplace transmission.
Combining these, Appendix 3 works through a two-component SIRS model and finds that at 5 eACH an office worker avoids roughly 0.1 respiratory infections per year ($69 in value), and a school child avoids roughly 0.5 ($208). At Aerolamp DevKit pricing, a 4-worker office has a benefit-cost ratio near 3.7 and a 25-student classroom is closer to 35. The classroom case is robust because children spend most of their waking hours at school and have higher per-strain attack rates than adults. Other crowded, commonly used settings like gyms, restaurants, and public transit could also be promising.
Ubiquitous air cleaning would not eliminate seasonal colds and flu
At the population level, UVC can have two kinds of effect. If it reduces \(R_0\) but leaves it above 1, the disease still spreads and seasonal attack rates fall. If it reduces \(R_0\) below 1, transmission collapses.
Getting 5 eACH everywhere—homes, workplaces, transit, retail—gives \(\alpha \approx 0.3\), cutting transmission by about a third. This pushes \(R_{\text{eff}}\) below 1 only if \(R_0\) was below about 1.43 to begin with. Seasonal flu (\(R_0 \approx 1.3\)) sits just below boundary, but I'm skeptical that pushing \(R_{\text{eff}}\) just below 1 would actually eliminate it. The flu strains we measure today are the ones that win under today's countermeasures. Universal UVC is a different selection environment, and new strains may emerge with somewhat higher \(R_0\) values or lower far-UVC susceptibility. I keep a 50% stated guess for flu throughout.
Rhinoviruses (\(R_0 \approx 2\)) and coronaviruses (\(R_0 \approx 2.5\)) are too transmissible for elimination, so UVC only dents their attack rates. The ceiling here isn't UVC-specific; all respiratory diseases transmit through a mixture of long-range aerosols, short-range droplets, and fomites, and any intervention that clears the air predominantly reduces transmission through only the first of these three pathways. It is very hard to see how any such method could eliminate things like coronaviruses, given that some fraction of transmission is just caused by people being in close contact with each other.
Appendix 2 works through the per-pathogen arithmetic using the repeated-wave SIRS model, calibrated on primary-cohort attack rates and per-case costs; the total benefit is roughly $640 per adult per year in averted productivity and healthcare costs, against $300 per adult to cover their indoor space at Aerolamp DevKit pricing—a benefit-cost ratio of 2.1.
Scaled to 260M US adults, that's a recurring program of about $80 billion per year at Aerolamp DevKit pricing, on the order of 0.3% of GDP, against roughly $170 billion per year in seasonal-disease benefit. This is hardware cost only; at population scale, installation and maintenance labor would plausibly dominate the fixture cost itself.
Built-environment air cleaning won't scale by default
My interest in UVC is primarily in its ability to reduce risk from catastrophic pandemic, not its value against seasonal disease. Reducing seasonal disease is great—I'd certainly pay a lot to have fewer colds and flu—but the case is marginal at current prices, and even as UVC costs fall the upside is modest. That's not a return that drives ubiquitous infrastructure rollout, and I'm not optimistic we'll see one.
Air filtration is mature, cheap, and has existed for decades—by almost any reasonable standard of cost-effectiveness, it should probably already be ubiquitous in schools, workplaces, and public buildings. That it isn't, despite favorable economics, is a bearish sign for UVC. UVC and filtration do have different frictions, though—filtration can be loud or bulky, and UVC avoids that, so you might hope UVC has an easier deployment path. But UVC has its own safety and material-degradation concerns that filtration doesn't, so it's not clear UVC wins on net.
Both could be deployed with a deliberate push—building codes, a consumer-grade quality standard, or a major funder-backed procurement program could put effective filters in most public-facing buildings, with UVC following as costs fall. Safety studies and clearer regulation could specifically derisk UVC deployment. The total bill would be small relative to what we already spend on HVAC.
Absent pre-deployment, catastrophe relevance comes down to emergency ramp-up. For filtration this is more plausible than for UVC: filter media and fans are commodity items, and COVID showed that consumers can build effective Corsi-Rosenthal boxes at home from off-the-shelf parts. It was a massive missed opportunity not to push this during COVID; next time we'll know to.
UVC, by contrast, is a specialty lighting niche, and scaling production fast is hard. A global install base of roughly 10⁵ fixtures (Dataintelo (2025)) is built on roughly 20 small vendors (Görlitz (2023)) and specialized supply chains—KrCl excimer emitters, narrowband optical filters, driver electronics—that can't be converted from adjacent industries the way filter media can. Even at crisis-level demand and funding, standing up tens of millions of fixtures in a year isn't a capacity you can buy your way into; the factories and trained workforce don't exist, and building them takes years.
For a near-term ramp-up in built-environment defense, filtration is the bet by a lot, and it covers most of what UVC would. But the UVC field is small enough that a few million dollars in targeted derisking—safety studies, regulatory pathways, anchored deployments—is highly leveraged, and further work may yet show UVC performs better than current numbers suggest. The more distant goal is a world where indoor air cleaning is ubiquitous, whether through filtration, UVC, or more likely a mix of both. While this wouldn't entirely eliminate respiratory disease, it would still reduce disease burden considerably while leaving us in far better shape against more severe biological threats.
Thank you to Adin Richards, Aman Patel, Andrew Snyder-Beattie, Chris Bakerlee, Christian Ruhl, Conor McGurk, Fiona Conlon, Jake Swett, James Wagstaff, and Richard Williamson for comments and/or discussion.
Appendix 1: Cost estimates for air cleaning technologies
All numbers for a 75 m³ room (30 m² × 2.5 m ceiling). Operating cost assumes 6 hours per day at $0.15/kWh—the number of hours per day a protected room is occupied and, equivalently, the duty cycle of the equipment.
| Technology | Upfront | eACH | Power (W) | Lifetime | 5-year consumables | 5-year electricity | 5-year total |
| Box fan + MERV-13 filter | $40 | 2.5 | 50 | Fan 10 yr, filter 1 yr | $75 (filters) | $82 | $197 |
| Corsi-Rosenthal box | $100 | 5 | 47 | Fan 10 yr, filters 1 yr | $140 (filters, bulk) | $77 | $317 |
| AirFanta 3Pro | $160 | 8 | 43 | 5+ yr | $200 (filters) | $71 | $431 |
| Philips 4000i HEPA | $540 | 8 | 60 | Filter 3 yr; device 5+ yr | $150 (filters) | $99 | $789 |
| Krypton-11 (Care222) | $2,499 | 4 | 10 | Lamp 10,000 h | $400 (1 lamp replacement) | $16 | $2,915 |
| UV Medico UV222 | $2,000 | 7 | 40 | Lamp 17,500 h | $0 (no replacement needed within 5-year window) | $66 | $2,066 |
| Aerolamp DevKit | $500 | 7 | 13 | Lamp 10,000 h | $0 (run past L70) | $21 | $521 |
| Upper-room 254 nm GUV (1 fixture) | $2,500 | 12 | 80 | 10+ yr | $500 (lamps) | $131 | $3,131 |
| Future far-UVC (Blueprint projection) | $110 | 7 | 11 | 30,000 h | $0 | $18 | $128 |
Sources
- Box fan + filter. CADR of 111 CFM (~189 m³/h) from Holder et al. (2022), baseline single-filter design. Materials cost and power draw are standard for a 20" box fan plus one MERV-13 filter.
- Corsi-Rosenthal box. CADR of 400 m³/h from independent testing in Dal Porto et al. (2022). Build cost and power draw (47 W) from HouseFresh (2025). Filter replacement at ~$28/year (four MERV-13 filters at ~$7 each in bulk from HVAC distributors); retail consumer pricing runs roughly 2× this.
- AirFanta 3Pro. Price ($160), CADR (600 m³/h), and power draw from HouseFresh (2026).
- Philips 4000i HEPA (AC4236). Upfront price ($540), CADR (610 m³/h), and power draw (60 W) from Philips product page; these match the HEPA assumptions used in the CAiMIRA modelling tool referenced by Matysik et al. (2026). Filter replacement roughly $90 every 3 years per CAiMIRA, straight-lined to $30/yr.
- Krypton-11 (Far UV Technologies). Price ($2,499 per fixture) from ProLampSales (2025). Coverage (~400 sq ft / ~37 m²), ~70 mW of 222 nm output, and 10,000-hour rated lamp lifetime from the Far UV Technologies product page. The fixture uses the Ushio Care222 12W B1 module, the same dichroic-filtered KrCl excimer module shared by most consumer-accessible 222 nm fixtures on the US market today. eACH is scaled linearly from the UV Medico UV222 anchor (115 mW → 7 eACH in the 75 m³ reference room): Krypton-11's 70 mW delivers ~4 eACH per fixture. 5-year consumables assume one lamp replacement at $400; the 10,000-hour rated life is just inside the 10,950 operating hours over 5 years at 6 h/day.
- UV Medico UV222. Pricing and 17,500-hour lamp lifetime from current UV Medico product literature. UV Medico does not publish a standalone replacement-lamp SKU; end-of-life replacement is assumed to be a whole-fixture swap at fixture cost, though at 6 hours/day the rated lamp life comfortably exceeds the 5-year window and no replacement is needed. eACH estimate consistent with Blueprint for Far-UVC (2025), Chapter 8.
- Aerolamp DevKit. Price ($500), 12.9 W input, 100 mW of 222 nm output from a Care222 B1 module, and 10,000-hour L70 lamp life from the Aerolamp DevKit product page. The fixture uses the same Ushio Care222 B1 module shared by Krypton-11 and most consumer-accessible 222 nm fixtures on the US market today. eACH is scaled linearly from the UV Medico UV222 anchor (115 mW → 7 eACH) with a modest geometric uplift for closer-to-occupant mounting: 100 mW × 7/115 ≈ 6 eACH at matched geometry, rounded to 7 with the mounting advantage. At 6 hours/day, the 10,000-hour rated L70 life sits just inside the 5-year window (10,950 operating hours). No replacement is assumed: L70 means the lamp still produces 70% of initial output at rated life, not that it fails, and running past L70 is standard practice for KrCl excimer lamps. This yields modestly degraded eACH in years 4–5 but avoids the cost of a full fixture swap (Aerolamp does not publish a standalone replacement module SKU). The Krypton-11 row does assume one lamp replacement at $400, since its lower per-fixture eACH makes the output loss more material.
- Upper-room 254 nm GUV. 10–16 eACH range from ACHR News (2025); fixture cost ($700–$1,500 for major US/EU manufacturers—American Ultraviolet's TB/CM/RAM series, Light Progress UV Flow E40/E75) from Regency Supply (2025), with comparable installation cost on top.
- Future far-UVC (Blueprint projection). Device cost, far-UVC output, input power, and rated lifetime from Blueprint for Far-UVC (2025) Table 8.2's "possible future" KrCl luminaire: $110 device, 110 mW of far-UVC output, 11 W input, 30,000-hour rated lifetime, $0.19 per mW per year of delivered fluence. Blueprint's table also lists $200 of installation cost, dropped here for consistency with the other plug-in fixture rows (only the upper-room 254 nm GUV row includes install). eACH is scaled linearly from the UV Medico UV222 anchor (7 eACH at 115 mW of output in the 75 m³ reference room, also from Blueprint Chapter 8): the future fixture's 110 mW output delivers \(110/115 \times 7 \approx 6.7\) eACH, rounded to 7. 5-year electricity at 6 h/day × $0.15/kWh is 11 W × 10,950 h × $0.15/kWh / 1000 = $18; at 30,000 h rated lifetime, 10,950 operating hours sits well inside the first lifetime and no replacement is required in the 5-year window. 5-year total: $110 device + $0 install + $0 replacements + $18 electricity = $128, or $18 per eACH.
Pathogen and aerosol-size dependence
The eACH figures are not pathogen-neutral. UVC inactivation is log-linear in dose, so the eACH delivered by a fixed install scales with the pathogen's susceptibility \(k\) (log-inactivation per unit fluence at 222 nm, cm²/mJ). Each UVC row in the cost table inherits whichever pathogen its source uses: Krypton-11's 4 eACH is calibrated against HCoV-229E (\(k = 4.1\) cm²/mJ benchtop; Buonanno et al. (2020)); UV Medico's 7 eACH follows Blueprint for Far-UVC (2025), also in the coronavirus band; upper-room 254 nm GUV traces to CDC/NIOSH guidance benchmarked against M. tuberculosis, corresponding to \(k \approx 1\)–\(3\) cm²/mJ in the respiratory-virus band. HEPA rows are pathogen-neutral—filters remove whole aerosols regardless of what's inside.
Bench and room-scale aerosol measurements disagree. Where both exist for the same pathogen, aerosol \(k\) runs 3–10× above benchtop \(k\), most of it probably a dose-delivery artifact but with some residual that might reflect real aerosol-phase enhancement. Even setting the bench-versus-aerosol gap aside, inter-lab \(k\) for the same pathogen in nominally similar setups commonly varies by 1–2 orders of magnitude, so any single headline number carries wide implicit uncertainty. Holding the Krypton-11 install fixed and rescaling by \(k\):
| Pathogen | \(k\) at 222 nm (cm²/mJ) | Implied eACH | Source |
| Coronaviruses (SARS-CoV-2, 229E, OC43) | 4.1 / 12–16 aerosol | 4 / 12–16 | Buonanno et al. (2020); Welch et al. (2022) reanalysis |
| Influenza A (H1N1) | 1.8 / 20 aerosol | 1.8 / 20 | Welch et al. (2018); Buonanno et al. (2024) |
| Norovirus (murine surrogate) | 2.4 bench | 2.3 | Buonanno et al. (2024) |
| Adenovirus | 0.14 bench | 0.14 | Oh et al. (2020) |
| B. subtilis spores | 0.36 bench | 0.35 | Taylor et al. (2020) |
I use the conservative anchors for the headline BCRs in A.2 and A.3 because Welch et al. (2022) argue that roughly 3× of the gap is dose-delivery systematics rather than underlying susceptibility, and the very high aerosol numbers rest on one chamber lineage (Eadie et al. (2022) / Hiwar et al. (2025) for bacteria). Adenovirus and B. subtilis are bench-only because no 222 nm aerosol measurement exists for either. Rhinovirus has no 222 nm entry for any human serotype; the only 222 nm Mycobacterium datum (on M. smegmatis) reports a single-dose log-reduction without a first-order \(k\) fit. UV Medico and upper-room GUV scale with \(k\) the same way; HEPA rows do not shift.
\(k\) is also conditional on droplet size. 222 nm light is absorbed within roughly 1 µm of dried respiratory fluid (Hill et al. (2024)), so sub-µm breath-generated particles—where most long-range aerosol mass sits—are efficiently inactivated, but cough- and sneeze-sized droplets need roughly 4–8× the dose for equivalent inactivation. Experimental dose-response data across the droplet-size range is sparse, and the chamber measurements underlying the \(k\) values above are typically in the breath/speech size range rather than at cough/sneeze sizes. The eACH numbers in the cost table are best read as size-averaged at a reference droplet distribution typical of breathing and speech; they would be lower against pathogens or settings dominated by larger droplets. Filtration captures whole aerosols regardless of size.
Appendix 2: Single-component SIRS model for ubiquitous UVC
How much does ubiquitous UVC cut a person's annual probability of catching a given respiratory virus? This depends on two parameters: the basic reproduction number \(R_0\), and the fraction \(\alpha\) of transmission that UVC blocks. A single-component final-size model lets us convert \(\alpha\) into a relative risk reduction per pathogen.
Single-component model
Pandemic virus, time-averaged endemic pathogen, and repeated annual waves on partial immunity nest inside one equation. Let \(q\) be the per-person per-wave attack rate: the probability that a given individual is infected over the course of a single wave, equivalently the fraction of a well-mixed population that has been infected by wave's end. The force of infection \(f\) each person experiences over the wave is the probability any given contact is infected—which, in a well-mixed population, is just \(q\)—times \(R_0\), the number of infectious contacts per person:
\[
f = q R_0.
\]
A person's probability of being infected given force of infection \(f\) is \(1 - e^{-f}\), so
\[
q = 1 - e^{-R_0 q}.
\]
For a pathogen returning in annual waves on a partially immune population, let \(\kappa\) be the fraction of the immune pool that has lost immunity by the time the next wave arrives. If \(S_0\) is the susceptible fraction at wave onset, the wave attack rate on a partially immune population is \(q = S_0(1 - e^{-R_0 q})\)—susceptible fraction times the per-susceptible infection probability. At periodic steady state, the fraction infected each wave equals the fraction whose immunity has waned since the last wave: \(1 - S_0 = q/\kappa\). Combining,
\[
q = \left(1 - \frac{q}{\kappa}\right)\bigl(1 - e^{-R_0 q}\bigr).
\]
This has no closed form but is easy to solve numerically for \(q\) given \(R_0\) and \(\kappa\). It recovers the single-wave equation as \(\kappa \to \infty\) (immunity washes out entirely between waves—the pandemic limit). As \(\kappa \to 0\) we recover the endemic pathogen result,
\[
q \approx \kappa \cdot \frac{R_0 - 1}{R_0}, \qquad S_0 \approx \frac{1}{R_0},
\]
applicable to an endemic pathogen whose per-wave attack rate is small and whose susceptibility pool barely turns over between waves.
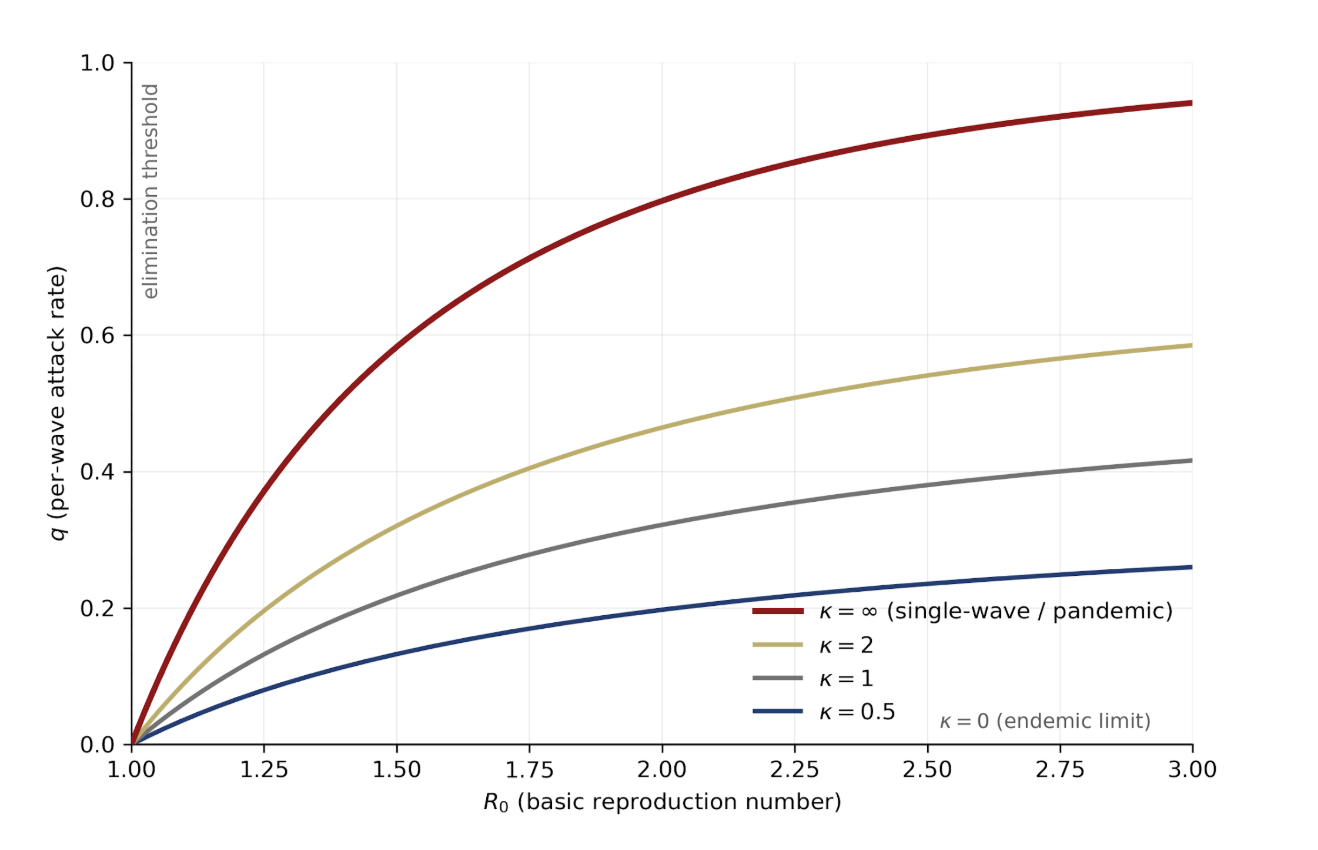
The per-wave attack rate \(q\) as a function of \(R_0\) for several values of \(\kappa\). The endemic limit (\(\kappa \to 0\)) is the flat \(q = 0\) line; the pandemic limit (\(\kappa \to \infty\)) is the single-wave final-size curve at the top.
How much does blocking fraction \(\alpha\) of transmission cut the per-wave attack rate? UVC, filtration, and masks all act on transmission rather than on immune waning, so blocking \(\alpha\) replaces \(R_0\) with \(R_0(1-\alpha)\) while leaving \(\kappa\) untouched. The post-intervention steady state is a sideways move on the plot above—same \(\kappa\)-curve, shifted left.
Pathogen parameters
To apply the model we need two observable parameters per pathogen, \(R_0\) and \(q\); the waning parameter \(\kappa\) is then pinned directly via the equations:
\[
S_0 = q/(1 - e^{-R_0 q})\,,\qquad \kappa = q/(1 - S_0).
\]
I use per-strain values: \(q\) is the per-wave attack rate for a single strain in a single year, not aggregated across the several co-circulating strains that make up each pathogen. \(q\) is a probability between 0 and 1. Adults who catch several rhinovirus colds a year are not catching the same serotype several times—they are catching different serotypes, and each serotype has its own per-wave attack rate in the teens. The mean number of infections per adult per year is \(Nq\), not \(q\), and this is what multiplies RRR to get cases averted.
| Pathogen | \(R_0\) | \(q\) per strain | \(N\) | \(\kappa\) | Infections per adult per year | Source | |
| adult | child | ||||||
| Rhinoviruses | 2.0 | 0.12 | 0.24 | 15 | 0.27 | 2.0 | Byington et al. BIG-LoVE (2015) |
| Seasonal flu | 1.3 | 0.08 | 0.16 | 2 | 0.42 | 0.08 | Malosh et al. HIVE (2021); Biggerstaff et al. (2014) |
| Endemic SARS-CoV-2 | 2.5 | 0.20 | — | 1.5 | 0.41 | 0.26 | Nash et al. PEACH (2024) |
| Seasonal HCoVs | 2.3 | 0.10 | 0.18 | 2 | 0.20 | 0.09 | Monto et al. HIVE (2020) |
| RSV | 2.5 | 0.05 | — | 1 | 0.09 | 0.05 | Falsey et al. (2005) |
Rhinovirus is the one inferred row: no cohort genotypes every rhinovirus detection, so per-serotype \(q\) is the aggregate probability of at least one rhinovirus per year divided by \(N \approx 15\) effectively co-circulating serotypes (Kamau et al. (2019) typed 26 distinct types over six months; \(N = 15\) is a modeling choice inside the 10–20 literature range, worth a factor-of-1.5 on per-serotype \(q\)).
Transmission reduction from UVC
How much of transmission UVC blocks depends on deployment intensity. At sufficient eACH, UVC can in principle eliminate essentially all long-range aerosol transmission in a treated room. The fraction carried by long-range aerosols is poorly quantified but plausibly around half for most respiratory viruses, the rest going through short-range droplets, contact, and fomites where UVC is less useful (Wang et al. (2021); Leung (2021)). Aggressive UVC treatment therefore has a typical ceiling of \(\alpha \sim 0.5\) for endemic respiratory diseases, but the exact share varies by disease and setting and is uncertain. I assume \(\alpha \approx 0.5\) throughout for simplicity, which is plausible but has plenty of uncertainty.
With background ventilation \(\mathrm{ACH}_0\) and UVC adding \(\Delta\mathrm{ACH}\), the airborne fraction UVC removes is
\[
\Delta\mathrm{ACH} / (\mathrm{ACH}_0 + \Delta\mathrm{ACH}).
\]
Naively, halving aerosol concentration halves infection risk, so \(\Delta\mathrm{ACH} = \mathrm{ACH}_0\) gives \(\alpha = 0.25\) and \(\Delta\mathrm{ACH} = 3\,\mathrm{ACH}_0\) gives \(\alpha \approx 0.4\).
Real returns diminish faster because infectious doses often sit well above threshold: cutting a colleague's dose from ten times threshold to five barely affects whether they get sick. Offices and schools typically have 1–3 ACH of background ventilation; adding 5 eACH of UVC plausibly gives \(\alpha \approx 0.3\), which I take as the central value below.
Cost of a respiratory infection
We will consider both lost productivity and direct healthcare. I value an hour of lost work at the employer's total cost of labor, $48.78/hr for US civilian workers (BLS ECEC (Q4 2025)). A cold costs a working adult about 9 hours from absenteeism and presenteeism combined (Bramley et al. (2002)), or roughly $440, plus around $70 in direct medical spending (Fendrick et al. (2003)'s ~$17B aggregate cold-related direct cost divided by roughly 500 million US cold episodes per year, medical-CPI-adjusted to 2026)—call it $510 per cold. Flu is more severe: roughly 24 hours of lost work (Van Wormer et al. (2017)) and around $600 in expected medical costs once a probability-weighted share of ED visits and hospitalizations is included (Putri et al. (2018))—roughly $1,800 per flu. For endemic SARS-CoV-2 I use $1,400 per case—roughly 20 hours of lost work (Di Fusco et al. (2023); roughly $975), $250 probability-weighted acute medical, and a $200 long-COVID tail (3% of cases at $10k lifetime per Cutler (2022)); defensible range $900–$2,200 driven almost entirely by long-COVID accounting. For adult RSV I use $1,000 per case: 15 hours lost (Mendes et al. (2026)) plus probability-weighted medical, sitting between cold and flu.
Final results
Applying \(\alpha = 0.3\) to each pathogen's \((R_0, q)\) via the repeated-wave equation gives a per-strain relative risk reduction; multiplying by the mean annual infection count per adult gives cases averted, and by dollar cost per case gives value averted:
| Pathogen | \(R_0\) | \(q\) | RRR per strain | Infections per year | Cases averted | $/case | Value averted |
| Rhinovirus | 2.0 | 0.12 | 43% | 2.0 | 0.85 | $510 | $435 |
| Endemic COVID | 2.5 | 0.20 | 28% | 0.26 | 0.073 | $1,400 | $102 |
| Seasonal HCoVs | 2.3 | 0.10 | 33% | 0.09 | 0.030 | $510 | $15 |
| RSV | 2.5 | 0.05 | 29% | 0.05 | 0.014 | $1,000 | $14 |
| Flu | 1.3 | 0.08 | 50% (guess) | 0.08 | 0.04 | $1,800 | $72 |
| Total | 2.48 | 1.01 | $640 |
The per-strain RRR applies uniformly across the co-circulating serotypes and subtypes of each pathogen, so aggregate cases averted scale with the mean infection count—cutting a typical adult from 2.0 rhinovirus colds a year to 1.15, endemic COVID from 0.26 to 0.19. Flu is a special case: \(R_0 = 1.3\) puts it below the elimination threshold at \(\alpha = 0.3\) (\(R_0(1-\alpha) = 0.91\)), so the repeated-wave equation reads "100% eliminated". I don't buy that—flu's year-to-year susceptibility refresh is antigenic drift rather than antibody waning, and SIRS doesn't model drift. The 50% in the table is a guess.
Cost of UVC
A typical adult occupies about 300 m³ of indoor space (180 m³ home, 120 m³ split across workplace, transit, and retail)—four 75 m³ rooms. The Aerolamp DevKit row from A.1 annualizes to $15 per eACH per year (no lamp replacement), so a 5-eACH install is $75 per room per year, or $300 per adult per year. Against the $640 of value averted, that gives a benefit-cost ratio of 2.13. At commercial-fixture pricing (UV Medico, ~$60 per eACH per year, $1,200 per adult per year) the BCR drops to 0.53.
Appendix 3: Two-component extension for workplace UVC
A.2's single-component model assumes UVC is deployed uniformly across every setting a person occupies. The more common real-world question is what happens when one setting is treated—a workplace, a school—and the rest of the world is not. A worker's annual risk now depends on four parameters: \(R_0\), the baseline per-wave infection rate \(q\), the fraction \(w\) of baseline exposure received in the treated setting, and the fraction \(\alpha\) of transmission inside that setting that UVC blocks.
Naively, risk would fall by \(w\alpha\). This is wrong on two fronts that pull opposite ways. A worker whose workplace exposure is blocked may still catch the pathogen on the bus or from a housemate—substitution reduces the counterfactual. But each averted workplace infection also removes a transmitter who would have seeded downstream chains—chain-breaking adds to it. A two-component final-size model puts both on one ledger.
Two-component model
Split exposure into two compartments. A worker receives fraction \(w\) of their baseline exposure in a treated workplace, where UVC blocks a fraction \(\alpha\) of transmission, and the remaining fraction \(1-w\) from the untreated general population. Write \(q_W\) for the worker's per-wave attack rate and \(q_P\) for the general-population attack rate.
The force of infection a worker sees over a wave is a weighted sum of contact probabilities from the two settings, each scaled by \(R_0\). The workplace contributes \((1-\alpha) w q_W\): coworkers are infected at rate \(q_W\), the worker spends fraction \(w\) of exposure there, and UVC knocks within-setting transmission down by a factor \(1-\alpha\). The outside world contributes \((1-w) q_P\): the rest of the population is infected at rate \(q_P\) and the worker spends fraction \(1-w\) there. So
\[
f_W = R_0 \bigl((1-\alpha) w q_W + (1-w) q_P\bigr).
\]
Applying the force-of-infection probability \(1 - e^{-f_W}\) and the same waning-replenishment relation \(1 - S_0 = q_W/\kappa\) as in A.2 gives the worker equation
\[
q_W = \left(1 - \frac{q_W}{\kappa}\right)\Bigl[1 - \exp\!\bigl(-R_0\bigl((1-\alpha) w q_W + (1-w) q_P\bigr)\bigr)\Bigr].
\]
The \(\kappa\) here is the same \(\kappa\) as in A.2—pathogen-level, not setting-level. Immunity does not know which compartment it was acquired in, so waning proceeds at the same rate for work-acquired and home-acquired immunity, and \(\kappa_W = \kappa_P \equiv \kappa\). UVC reduces the probability of becoming infected but does not change how long subsequent immunity lasts.
The coupling is one-way, because a single workplace is small compared to the entire population. The parameter \(q_P\) is therefore just the single-component A.2 answer: solve \(q_P = (1 - q_P/\kappa)(1 - e^{-R_0 q_P})\) once, then substitute into the worker equation and solve that separately. With \(q_P\) in hand the worker equation is a one-dimensional implicit equation in \(q_W\) that is easy to solve numerically.
Choosing \(w\)
Workplaces are a modest source of infection for adults: most respiratory viruses come from family, public transit, and social contacts. A reasonable range is \(w \in [0.10, 0.25]\), with 0.25 a generous upper end. Schools are different. Children spend most of their waking hours with a large peer pool, and school-age kids are the main reservoir for seasonal respiratory viruses, so \(w \approx 0.5\) is plausible for a child. Reasonable values of \(\alpha\) are covered in A.2; I use the same \(\alpha = 0.3\) central value here.
Reduction in risk
Applying \(\alpha = 0.3\) at the central \(w\) for each setting to the per-strain \((R_0, q)\) pairs from A.2 gives the per-worker / per-child risk reductions and annual cases averted. We find that for an adult worker at \(w = 0.25, \alpha = 0.3\):
| Pathogen | \(R_0\) | \(q\) | RRR per strain | Infections per year | Cases averted | $/case | Value averted |
| Rhinovirus | 2.0 | 0.12 | 4% | 2.00 | 0.086 | $510 | $44 |
| Endemic COVID | 2.5 | 0.20 | 3% | 0.26 | 0.009 | $1,400 | $12 |
| Seasonal HCoVs | 2.3 | 0.10 | 4% | 0.09 | 0.003 | $510 | $2 |
| RSV | 2.5 | 0.05 | 3% | 0.05 | 0.002 | $1,000 | $2 |
| Flu | 1.3 | 0.08 | 7% | 0.08 | 0.005 | $1,800 | $10 |
| Total | 0.11 | $69 |
For a school-age child at \(w = 0.5, \alpha = 0.3\):
| Pathogen | \(R_0\) | \(q\) | RRR per strain | Infections per year | Cases averted | $/case | Value averted |
| Rhinovirus | 2.0 | 0.24 | 10% | 3.60 | 0.362 | $350 | $127 |
| Endemic COVID | 2.5 | 0.20 | 8% | 0.26 | 0.020 | $750 | $15 |
| Seasonal HCoVs | 2.3 | 0.18 | 9% | 0.36 | 0.031 | $350 | $11 |
| RSV | 2.5 | 0.05 | 8% | 0.05 | 0.004 | $1,000 | $4 |
| Flu | 1.3 | 0.16 | 17% | 0.32 | 0.054 | $950 | $51 |
| Total | 0.47 | $208 |
Rhinovirus again drives most of the infections averted. Flu is not sub-threshold here the way it was in A.2: external exposure keeps the worker's steady state away from zero even when \(R_0(1-\alpha) < 1\) inside the workplace, and the model returns well-behaved RRRs of 7% for adults and 17% for children.
Pediatric $/case values run at roughly half the adult anchors because children carry no direct lost-work productivity—a sick child drives caregiver absenteeism at around 60% of an adult's own hours (Palmer et al. (2010))—and because pediatric hospitalization rates for flu and endemic COVID run several-fold below adult rates in the 5–17 band (Pike et al. (2023) for pediatric COVID direct-medical excess). The school-age RSV row reuses the adult parameters for simplicity; infant RSV is a separate, much larger per-case risk that belongs in its own population-specific calculation rather than folded into the classroom arithmetic.
Cost-benefit
A 5-eACH install in a 75 m³ office, at the Aerolamp DevKit row's $15 per eACH per year from A.1 (no lamp replacement), is $75 per room per year. At four workers per room the benefit is 4 × $69 ≈ $280, a benefit-cost ratio of about 3.7 at the generous \(w = 0.25\) (or 0.9 at commercial-fixture pricing).
By comparison, a 25-student classroom at 150 m³ costs $150 per year at Aerolamp DevKit pricing and delivers 25 × $208 ≈ $5,200, a benefit-cost ratio close to 35 (or 9 at commercial-fixture pricing), driven by the combination of higher \(w\), higher per-strain \(q\), and higher occupancy per volume. More generally, the case for air cleaning tracks occupant density times time spent in the space—the same intuition behind ASHRAE 241, which sets much higher eACH targets for gyms than for offices.
- Other approaches—notably chemical disinfectant vapors like glycols ([Blueprint Biosecurity (2025)](https://blueprintbiosecurity.org/glycol-vapors/))—can also inactivate airborne pathogens and could be useful during an emergency, but aren't covered here. ↩
- It's worth noting that existing consumer air filters like AirFanta are over-specced for the task. What matters for room cleaning is eACH—capture rate times flow—and a 99.97% filter efficiency at 500 m³/h is basically the same as 90% efficiency at 550 m³/h. MERV-13 can deliver similar eACH at lower pressure drop, lower noise, and lower cost. ↩
- Upper-room 254 nm GUV has a mature, cheap mercury lamp, but deployed cost is dominated by louvers, shielding, and per-room safety commissioning. Consumer-DIY isn't an option the way it is for air filtration. ↩
- Although commercial air filters probably aren't operating at the efficiency frontier, for example by using HEPA filters (see footnote 2). ↩
- Aerolamp positions the DevKit as an uncertified development kit ("has not yet been through any certification processes" per the product page); the $500 row reflects the cheapest current Care222-based fixture, not the price of a productized, FCC- and UL-8802-certified consumer product.
Jeff Kaufman's post reaches ~$53 per eACH for the Aerolamp using aerosol-k coronavirus susceptibility (Welch et al. (2022)) and no lamp replacement (running past L70). I also assume no replacement for the Aerolamp but use bench k, which is why my costs per eACH are somewhat higher. ↩